Mastering Graphs — Why Context is Everything in Junior Cycle Maths
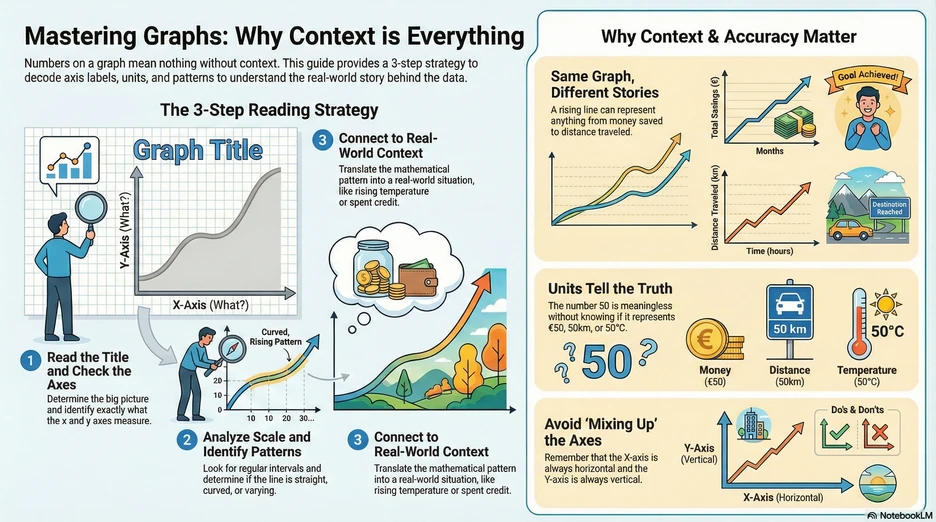
Numbers on a graph mean nothing without context. A rising line could show money saved, distance travelled, or temperature climbing — the graph alone doesn’t tell you which. This post walks through a 3-step strategy for reading any graph and explains why context and accuracy are everything.
The 3-Step Reading Strategy
Step 1: Read the Title and Check the Axes
Start with the big picture. Read the graph title, then identify exactly what the x-axis and y-axis measure.
Example: If the y-axis says “Distance (km)” and the x-axis says “Time (hours)”, you immediately know you’re looking at a distance-time graph.
Watch out! Skipping this step is the most common mistake. Without knowing what the axes represent, you can’t interpret anything else correctly.
Step 2: Analyse Scale and Identify Patterns
Look at the scale — are the intervals regular? Then examine the shape of the data. Is the line straight, curved, or curving? Is it rising or falling?
Example: A straight line rising from left to right shows a constant rate of increase. A curve getting steeper shows an accelerating rate.
Watch out! Check that the scale intervals are even. Uneven intervals can make data look more dramatic or flatter than it really is.
Step 3: Connect to Real-World Context
Translate the mathematical pattern into a real-world situation. A rising straight line might mean steady spending, constant speed, or a regular temperature increase — the axes and title tell you which.
Example: A rising curve on a “Temperature vs. Time” graph tells you the temperature is increasing and the rate of increase is getting faster.
Watch out! Always link your interpretation back to the units and labels. Saying “the line goes up” is not enough — say what is increasing and by how much.
Why Context and Accuracy Matter
Same Graph, Different Stories
A rising line can represent completely different things depending on context. The exact same upward curve could show:
- Money saved over months
- Distance travelled over time
- A goal being achieved step by step
Without axis labels and a title, you simply cannot tell which story the graph is telling.
Units Tell the Truth
The number 50 is meaningless on its own. Is it €50? 50 km? 50°C? The units on each axis turn raw numbers into real information.
Watch out! Always include units in your answers on the exam. “The value is 50” will lose marks — “The distance is 50 km” will not.
Avoid Mixing Up the Axes
A surprisingly common error — remember:
- The X-axis is always horizontal (left to right)
- The Y-axis is always vertical (bottom to top)
Watch out! When plotting points, the x-value always comes first: (x, y). Swapping them puts your point in the wrong place entirely.
Study tip
In the exam, always start with the title and axes before looking at the data. Write your answers using the correct axis labels and units — saying “the y-value increases” is weak, but “the temperature increases from 20°C to 50°C over 3 hours” shows real understanding. Context is what separates a good answer from a great one.
This post is based on an AI-generated infographic from Boomanotes — turn any study notes into visual revision aids.