Statistics & Probability Definitions — Key Terms for Junior Cycle Maths
Statistics and probability are two sides of the same coin in Junior Cycle maths. Statistics is about analysing data you already have, while probability is about predicting what might happen. This post covers all the key definitions across both topics, along with the common mistakes to avoid.
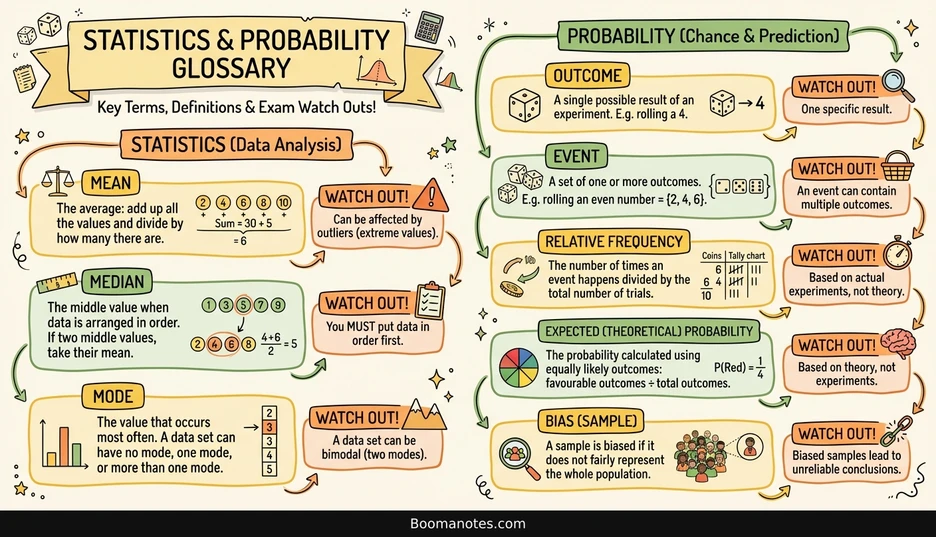
Statistics (Data Analysis)
Mean
The average: add up all the values and divide by how many there are.
Example: For the data set 5, 6, 6, 7, 6 → Sum = 30, Count = 5, so Mean = 30 ÷ 5 = 6
Watch out! The mean can be pulled by outliers (extreme values). A single very high or very low value can make the mean misleading.
Median
The middle value when data is arranged in order.
Example: For 1, 3, 6, 7, 9 → Median = 6 (the middle number)
If there are two middle values, take their mean: Example: For 1, 3, 4, 6, 7, 9 → Median = (4 + 6) ÷ 2 = 5
Watch out! You MUST put the data in order first. Finding the middle of unordered data gives the wrong answer.
Mode
The value that occurs most often.
Example: For 2, 3, 3, 5, 7 → Mode = 3
Watch out! A data set can have no mode (all values appear once), one mode, or more than one mode (bimodal or multimodal).
Probability (Chance & Prediction)
Outcome
A single possible result of an experiment.
Example: Rolling a die → one outcome is rolling a 4.
Watch out! One specific result — not a group of results.
Event
A set of one or more outcomes.
Example: Rolling an even number = {2, 4, 6}
Watch out! An event can contain multiple outcomes. Don’t confuse an event with a single outcome.
Relative Frequency
The number of times an event happens divided by the total number of trials.
Example: A coin is tossed 10 times and lands on heads 6 times → Relative Frequency = 6 ÷ 10 = 0.6
Watch out! Relative frequency is based on actual experiments, not theory. It can change every time you repeat the experiment.
Expected (Theoretical) Probability
The probability calculated using equally likely outcomes:
P(Event) = Favourable outcomes ÷ Total outcomes
Example: P(Red) on a spinner with 1 red and 3 blue sections = 1 ÷ 4 = 0.25
Watch out! This is based on theory, not experiments. It assumes all outcomes are equally likely.
Bias (Sample)
A sample is biased if it does not fairly represent the whole population.
Example: Surveying only students in one class about a school-wide issue would be a biased sample.
Watch out! Biased samples lead to unreliable conclusions. Always consider whether the sample represents the full population.
Study tip
Know the difference between statistics and probability — statistics describes data you have, probability predicts data you expect. In the exam, be precise with your language: say “relative frequency” not just “frequency”, and always specify whether you mean theoretical probability or experimental (relative frequency).
This post is based on an AI-generated infographic from Boomanotes — turn any study notes into visual revision aids.